

The recent wave of extreme weather—from “atmospheric rivers” drenching the drought-ridden west coast, to the unprecedented series of tornadoes ripping through the Midwest—are a perfect parallel to what investors experienced in March. Though “turbulent” has been a perfect descriptor for the dramatic turns in the market ever since the Fed first began boosting interest rates a year ago, things came to a bona fide boiling point last month, driven largely by the three bank closures that caused global panic, significant deposit outflows, and a brief but sharp downturn as a seeming crisis of confidence gripped global markets. And yet, despite the March Madness, the first quarter shaped up to be a winner. The ROBO Global Indexes were no exception, with gains posted across the board. The ROBO Global Artificial Intelligence Index (THNQ) jumped +22.8%, the ROBO Global Robotics & Automation Index (ROBO) returned +17.71%, and the ROBO Global Healthcare Technology & Innovation Index (HTEC) gained +3.33%.

That resilience begs the question: is it possible for the last decade’s playbook of growth to last forever? While the events of the last two weeks certainly exposed some idiosyncratic issues, in our opinion it is difficult to argue that the system itself faces any sort of existential threat beyond tighter overall financial conditions (which, albeit, are nothing to overlook). Still, with tech driving the bulk of the recent rally—and technology seemingly having nowhere to go but up—what’s to stop continued, rapid growth when the Fed’s tried-and-true methods can’t seem to dampen investor enthusiasm? A closer look at what took place this quarter may offer some clues.
1Q was all about mean reversion from the 2022 dynamics as interest rate expectations violently declined. Cracks in the banking system, easing inflation, and signs of some slowdown in US consumption have market participants anticipating the end of the Fed’s hike cycle within the year. At the same time, there was a marked reversal in stock valuations, with many of the big losers of 2022 rising to become big winners in 1Q. And while growth stocks recovered their market leadership position (driven by mega-cap tech, unprofitable tech, and expensive software stocks), small caps, healthcare, and defensive stocks underperformed. In the US, mega-cap tech stocks returned a whopping +31%, with the rest of the S&P returning just +2%.
Diving deeper into the ROBO Global Indexes, 1Q demonstrated the strength and potential growth trajectory of companies in robotics, AI, and healthcare technologies:
ROBO
The ROBO Global Robotics & Automation Index (ROBO) logged double-digit percentage gains for the second consecutive quarter, returning +17.71% and handily outperforming the 7.3% gain for the MSCI AC World Index (ACWI)1 by more than 10ppt during the quarter. The ROBO index of best-in-class robotics and automation equities around the world was led by strong gains in Computing & AI (+25%), Actuation (+22%), and Logistics Automation (+18%), while European (+12%) and Healthcare (+4%) stocks lagged.
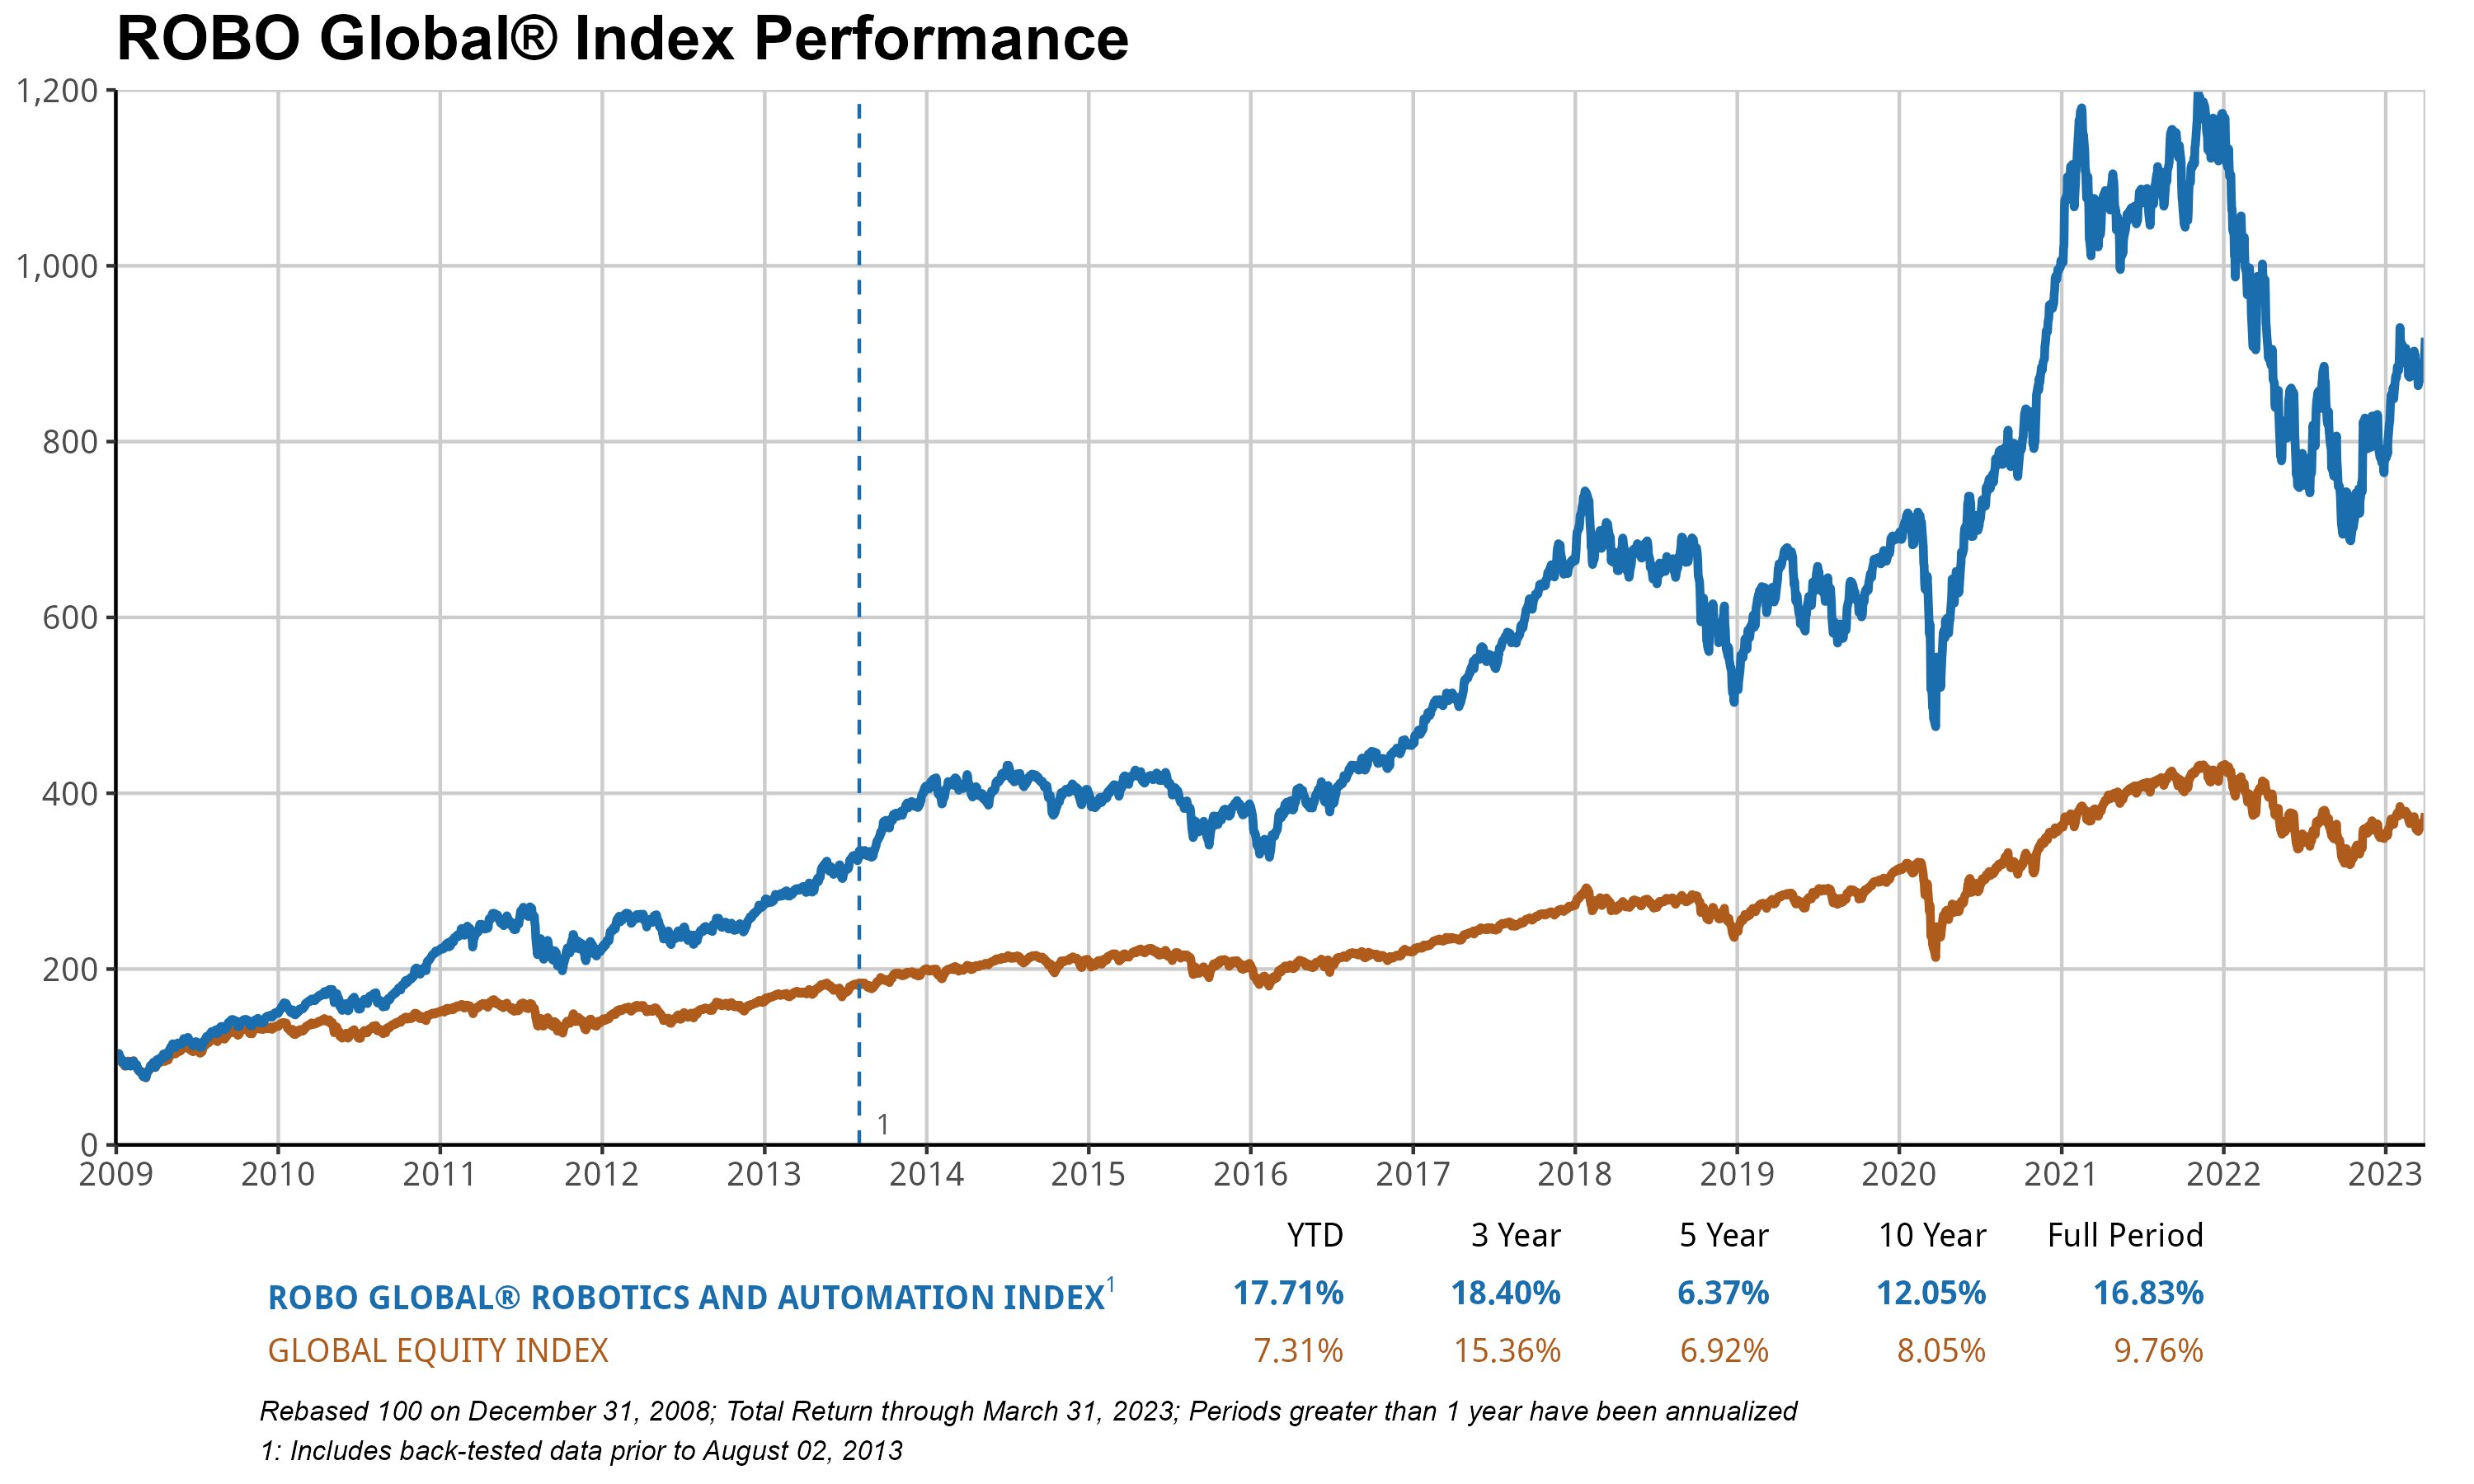
AI and semiconductor stocks delivered the strongest performance in Q1, with iFlyTek (+95%), Nvidia (+90%), Global Unichip (+71%), and Samsara (+59%) topping the charts. The advent of generative AI models, the ChatGPT craze, and the boom in eye-opening applications have certainly led to renewed optimism around the group, with valuations reaching astonishing levels once again. For example, Nvidia is now trading on 60x forward PE2 and 25x sales, not too far off its 2021 high of 70x PE3.
The good news is that other areas of the portfolio remain relatively cheap compared to the areas of the portfolio discussed above, especially cyclical stocks in industrial end-markets such as manufacturing and industrial automation (17x), food and agriculture (16x), and Japanese stocks (15x). We also note that non-US stocks, which account for 56% of the ROBO portfolio, are trading at a substantial discount (18x) compared to US stocks (36x). This is especially true in Japan. Japanese companies, which account for 22% of the ROBO index and have a combined 40% share of the world’s industrial robot market, are, in our opinion, poised to benefit from both the robust economic recovery in China after a chaotic path out of Covid restrictions, and the dramatic depreciation in the Japanese Yen, which provides a substantial cost advantage and should lead to margin expansion.
In aggregate, ROBO is trading on a 26x forward PE, compared with the 24x average since inception nearly 10 years ago and the 2021 high of 36x. Meanwhile, earnings growth remains strong relative to broad equity indices, with expectations for a 10% earnings per share4 (EPS) increase in 2023 (similar to what we saw in 2022), with 8% sales growth in line with the long-term average. We believe this reflects the strength in demand for automation. Adoption has continued to accelerate across increasingly broad swaths of the economy.
Despite the rapid increase in the cost of capital, M&A activity is robust in the Robotics & Automation space, with two index members, Stratasys and National Instruments, receiving takeover bids since the start of 2023. This brings the total number of takeover attempts on ROBO index members to 30 since 2013, with an average of about three per year.
In addition to the usual 1Q rebalance, March saw three changes to the ROBO index: Symbotic was added, and Amano and Shenzhen Inovance were excluded. We believe Symbotic has rapidly emerged as a leader in logistics and warehouse automation, thanks to its comprehensive solution for automating the processing of pallets and cases for retailers. In just a few years, it has amassed an enormous order backlog worth over $12 billion for more than 170 systems, primarily with Walmart5. Amano was excluded on reduced revenue and technology leadership scores, and Shenzhen Inovance was removed due to an increase in foreign ownership. Shenzhen Inovance has returned a total 279% since its inclusion in the ROBO index in 2019.
THNQ
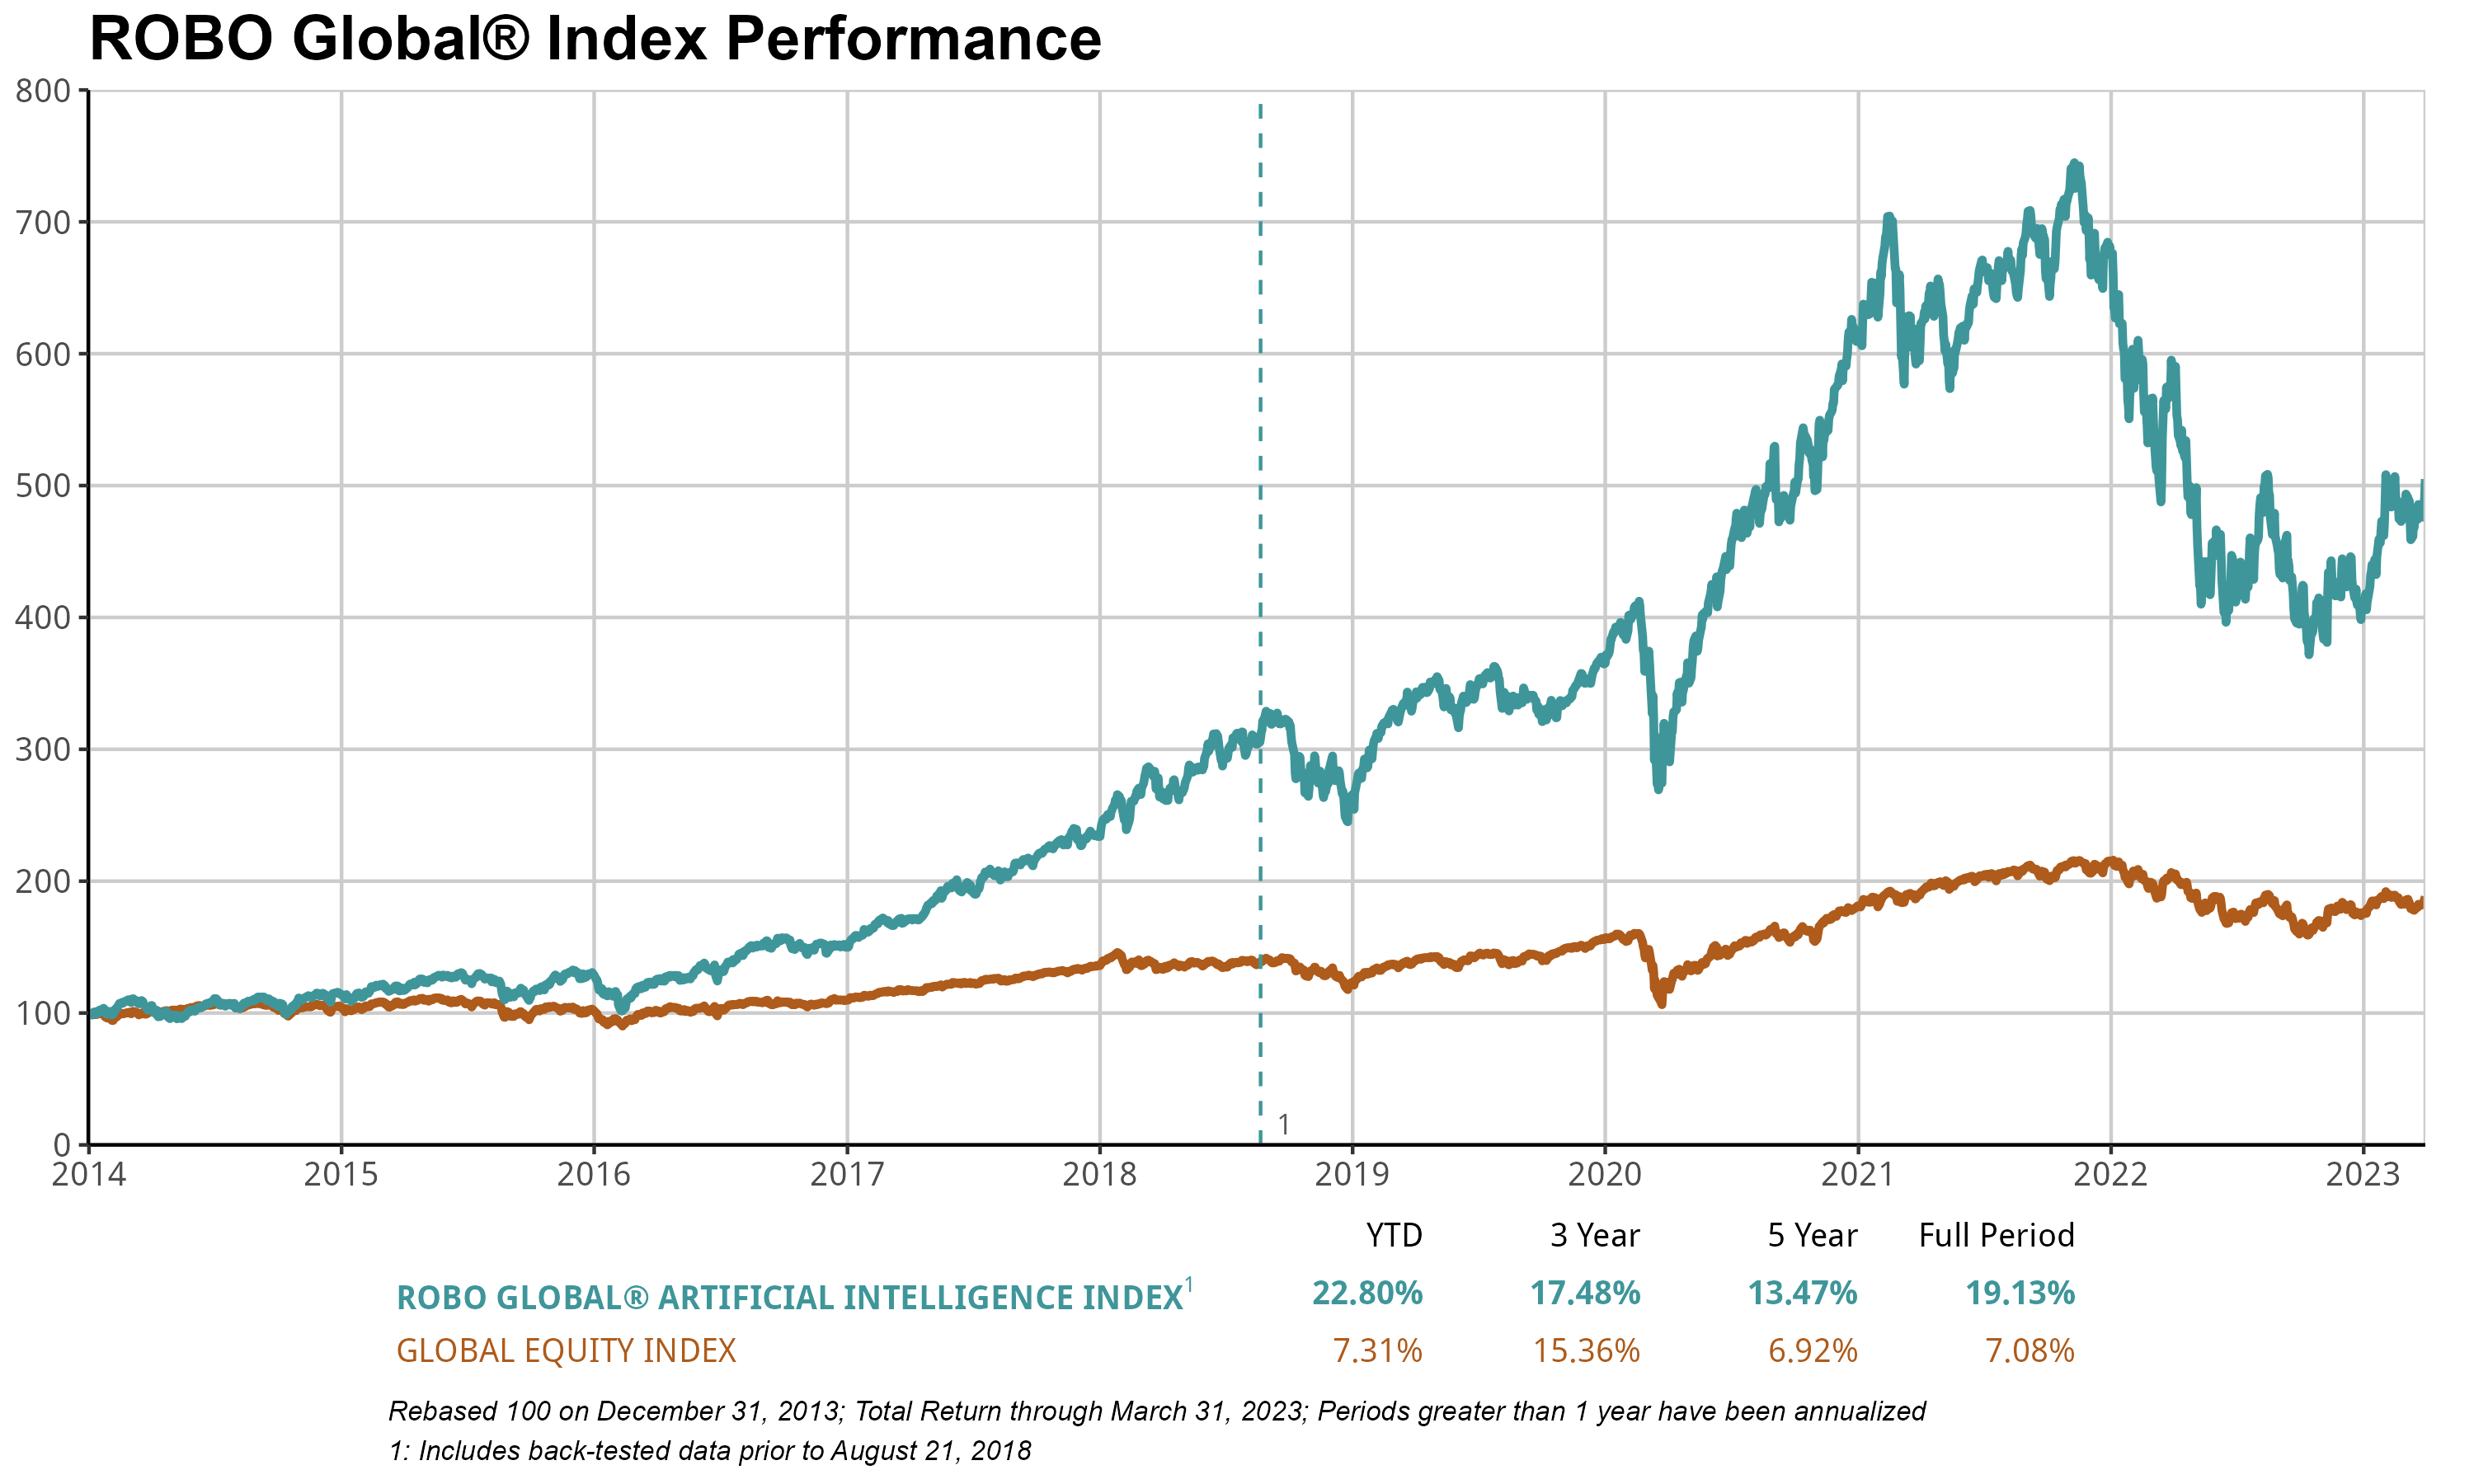
The ROBO Global Artificial Intelligence Index (THNQ) gained 22.8% in 1Q, far outperforming ACWI (+5%). The advances of ChatGPT have created tremendous optimism in the market, and we believe THNQ is a great way to capture the evolution of this ecosystem. AI, of course, reaches far beyond “just” data analytics. As many of the most influential technology visionaries in the world have opined, AI is the most disruptive technology innovation of our lifetime. Enterprises are embracing AI to use myriad sorts of data to their advantage and to integrate processes across all lines of business and industries. The list of applications is as impressive as it is vast.
ChatGPT, a member of the generative pre-trained transformer (GPT) family of language models, has gained popularity in recent years for its ability to generate human-like text content. It is a type of artificial intelligence (AI) that uses machine learning algorithms to analyze large amounts of text data and generate responses in a conversational manner. One reason for the ChatGPT craze is that it has the ability to hold natural and engaging conversations with users. It can understand and respond to a wide range of topics and can even generate personalized responses based on user input. This makes it a useful tool for tasks such as customer service, chatbots, and even creating content for social media or websites. Another reason for ChatGPT’s popularity is that it is relatively easy to use and requires minimal setup. Many software developers and companies have begun incorporating ChatGPT into their products and services, making it more widely available and accessible to the general public.
In our opinion, Nvidia is seen as the clear leader in AI, a sector that is predicted to grow dramatically—and quickly. According to a recent report[1], the global AI market was valued at $119 billion in 2022 and is expected to boom to $1.59 trillion as soon as 2030, resulting in an estimated compound annual growth rate6 (CAGR) of 38% between 2022 and 2030. The drivers of that growth stretch across the vast landscape of AI applications, including healthcare, finance, retail, automotive, and more. In a world where AI applications are a virtual “goldmine,” as a leading AI chip provider, NVDA is delivering the shovels required to dig for fortunes. NVDA’s AI products include a full line of hardware and software, ranging from NVIDIA GPU Cloud (targeting cloud applications) to NVIDIA Jetson (targeting autonomous machines), to NVIDIA TensorRT (targeting high-performance deep learning). The company posted over +90% growth in 1Q, helping to push the THNQ index to its own double-digit gains for the quarter.
HTEC
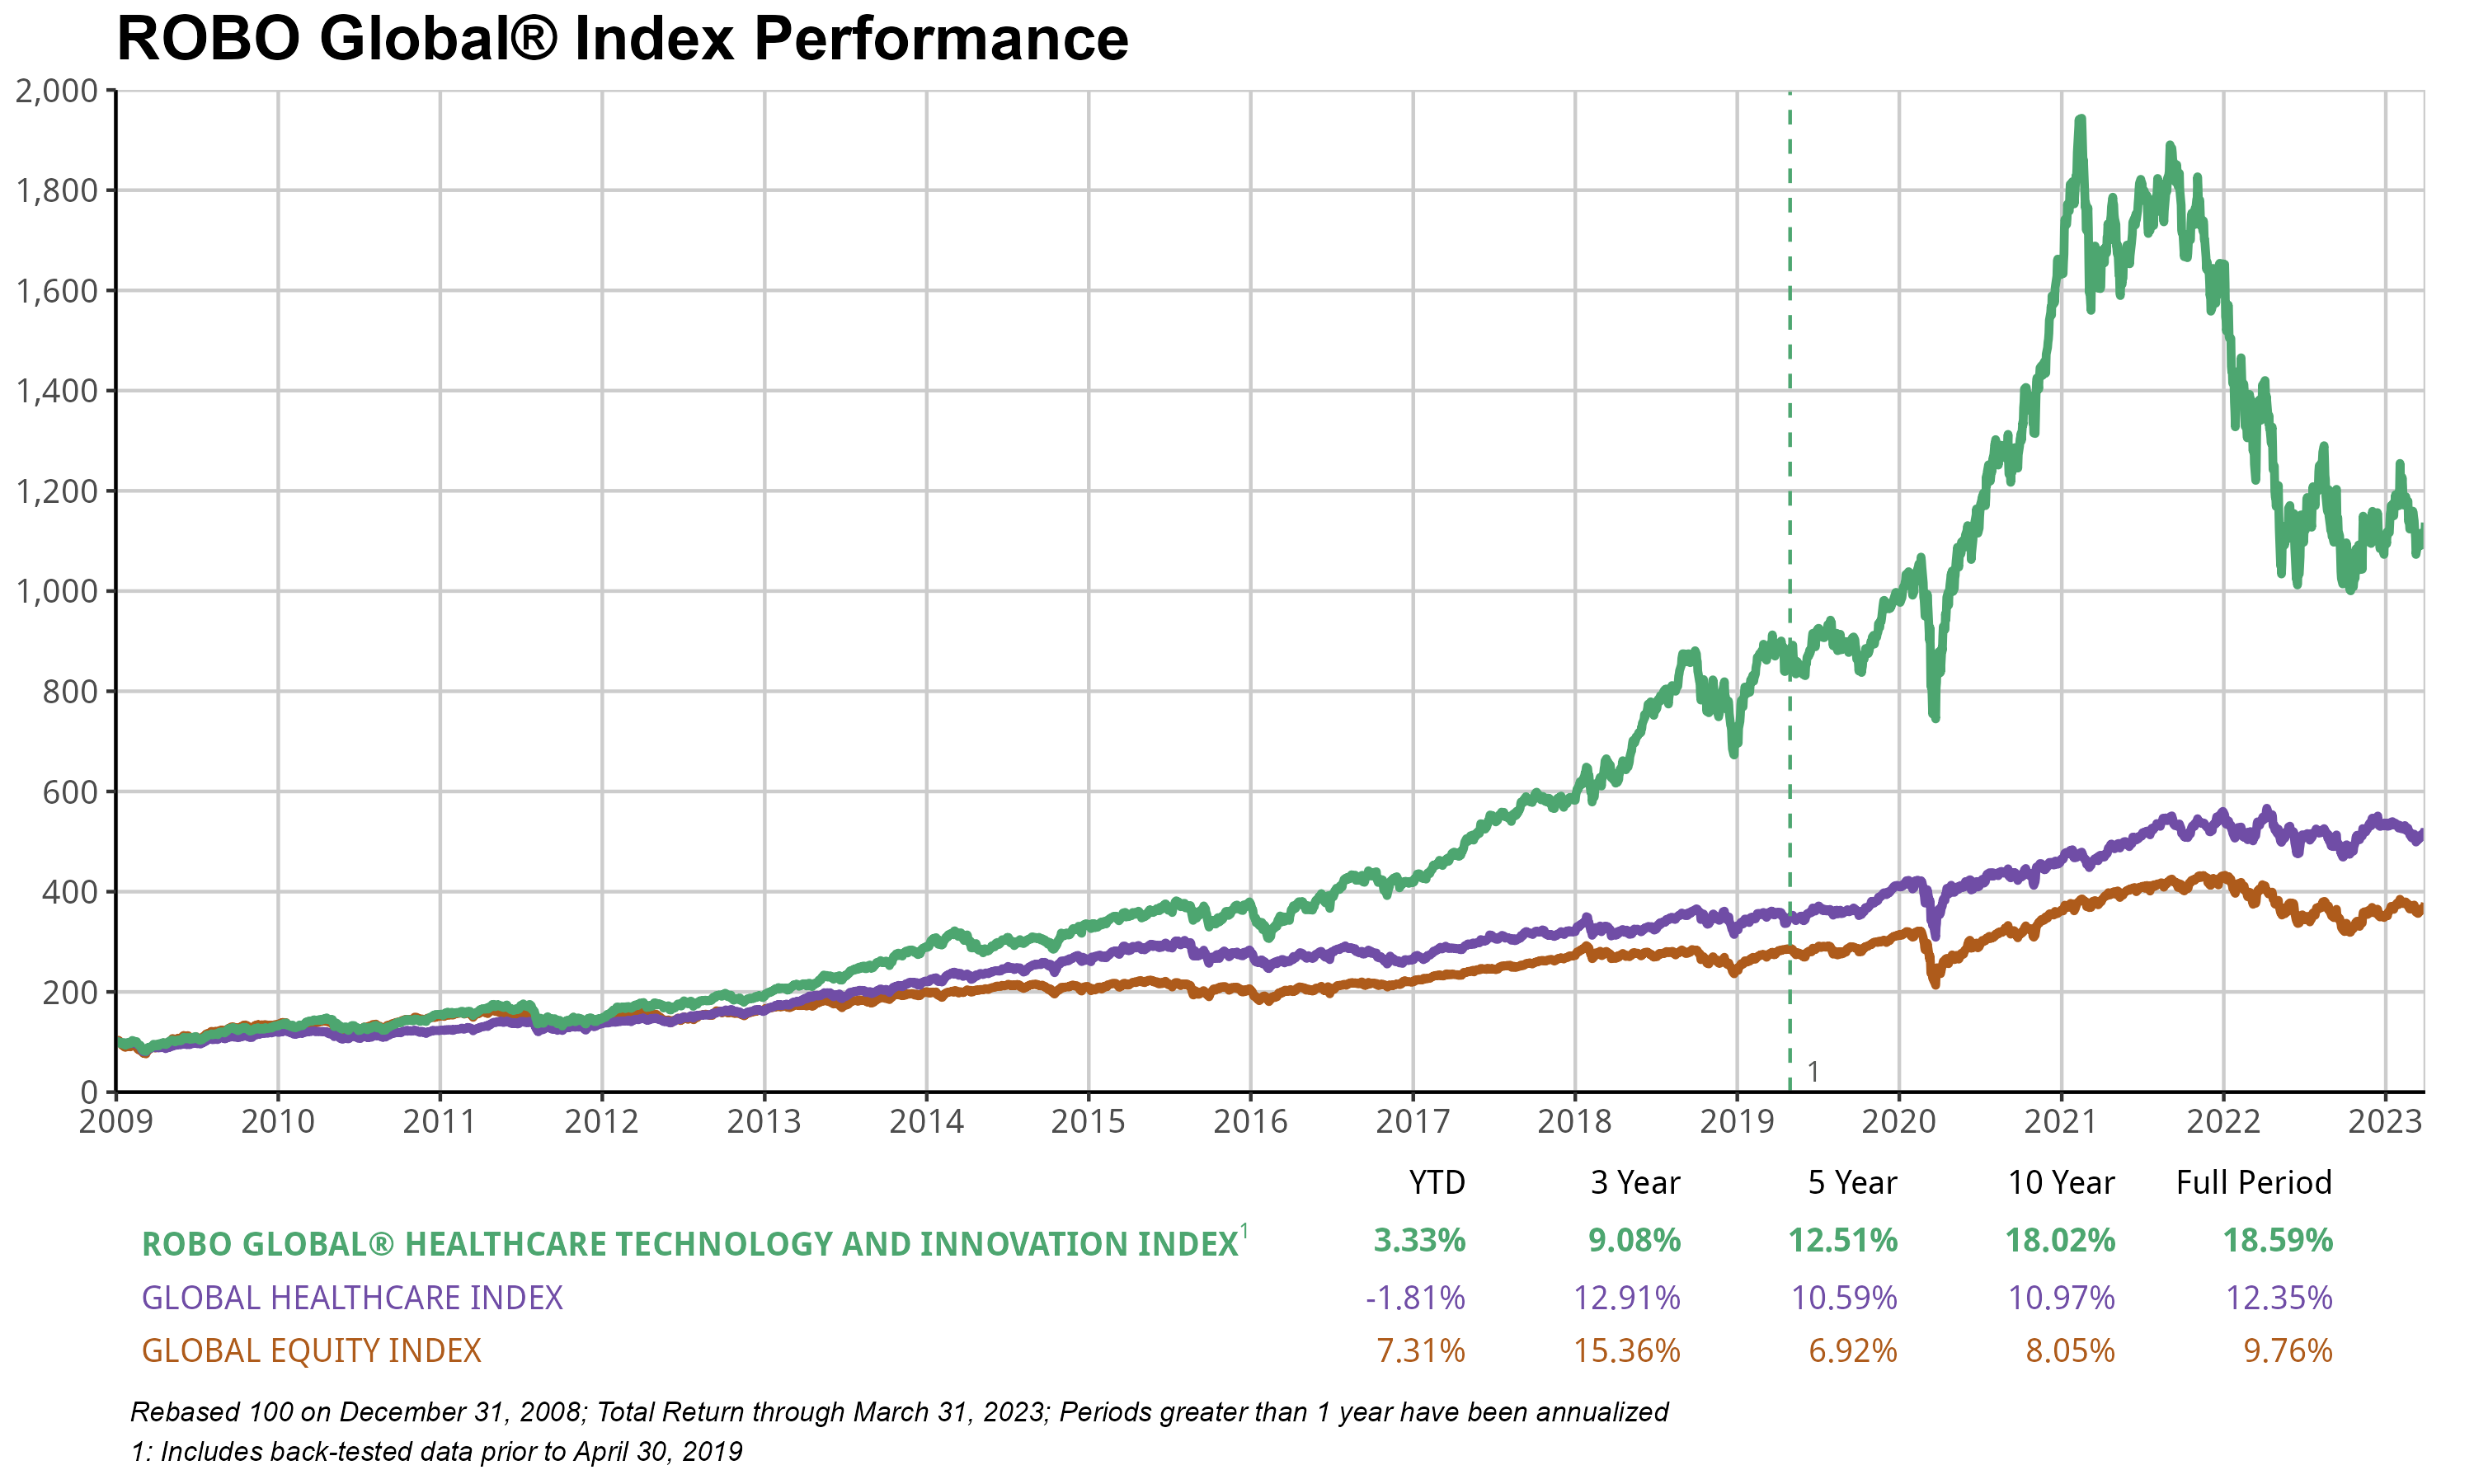
The ROBO Global Healthcare Technology & Innovation Index (HTEC) gained +3.18% in 1Q, slightly underperforming ACWI’s +5% gain. Positive gains were driven by Data Analytics (+12%), but this was offset by other sectors, including Regenerative Medicine (-17%) and Precision Medicine (-13%). Importantly, we continued to see major innovation milestones during the quarter, such as the collaboration between Vertex and CRISPR Therapeutics, which builds on their focus of creating cell and genetic therapies for eradicating serious diseases. A new licensing agreement between the two companies will likely accelerate the development of Vertex’s hypo-immune cell therapies for the treatment of type 1 diabetes. Cell and genetic therapies are key to their strategy of developing transformative therapies for serious diseases, and this agreement is an important next step in cementing their leadership in these modalities as they bring forward their broad gene and cell-based therapeutics portfolio.
Additionally, Natera announced more positive news less than 6 months after its VA coverage agreement for minimum residual disease monitoring (MRD). A new molecular diagnostics services program (MolDX) will now cover the Signatera molecular MRD for patients with IIb or more advanced breast cancer, including the HR-positive, HER2, and triple-negative types, adding to their existing colorectal, bladder, and pan-cancer monitoring. The announcement immediately increased the top and bottom line for 2023 and beyond, as the average selling price7 (ASP) is estimated to be $2.5K–$3.5K, and there are tens of thousands of eligible patients annually, which could see $30 million accretive this year—a possible 3–5% boost to the topline this year alone depending on adoption speed. The result: the stock jumped 17% on the day of the announcement.
Just as the dramatic weather patterns are expected to continue across the US and around the globe, there is no reason to anticipate calmer waters in the market in the months and years to come. The tendency for investors to react to crises of all kinds is unlikely to waver. At the same time, we believe it is clear that technology is adding value to nearly everything it touches, and when companies deliver technologies that drive value, investors may ultimately reap rewards. Regardless of how the economy, the Fed, or the “crisis of the moment” impacts the markets in the short term, watch for technology—including robotics, automation, and healthcare technologies—to act potentially as the predictable buoy that lifts portfolios higher and higher.
[1] Artificial Intelligence (AI) Market Size, Growth, Report 2022-2030, Precedence Research, January 2023
Sources & Definitions:
1 MSCI AC World Index is MSCI’s flagship global equity index, and is designed to represent performance of the full opportunity set of large- and mid-cap stocks across 23 developed and 24 emerging markets.
2 The forward P/E estimates the relative value of the earnings.
3 The price-to-earnings (P/E) ratio relates a company’s share price to its earnings per share.
4 Earnings per share (EPS) is a company’s net profit divided by the number of common shares it has outstanding.
5 Source: Symbotic
6 The compound annual growth rate (CAGR) is the rate of return (RoR) that would be required for an investment to grow from its beginning balance to its ending balance, assuming the profits were reinvested at the end of each period of the investment's life span.
7 The term “average selling price” (ASP) refers to the average price a good or service is sold for.